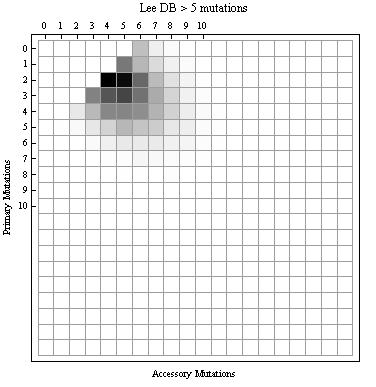
I like heatmaps. Using ClustalW is too limited to gene arrays though. I wanted something more generic. I tried both R and Mathematica to generate heatmaps and I like the Mathematica version better. Unfortunately it is in gray scale. I have the R version too which uses a color gradient and includes a key. But let’s talk about the Mathematica version.
In this example, I am importing in a tab separated file of a number matrix which I will use as input to the ArrayPlot command in Mathematica. I have also add tick labels. The commands and the final product are as follows:
mut5 = Import[“…\\tabSeperatedFile.tsv”]
{{0, 0, 0, 0, 0, 0, 277, 71, 18, 3, 0, 0, 0, 0, 0, 0, 0, 0, 0, 0}, {0, 0, 0, 0, 0, 580, 310, 157, 63, 20, 3, 1, 0, 0, 0, 0, 0, 0, 0, 0}, {0, 0, 0, 0, 1097, 1049, 49, 292, 130, 50, 7, 1, 1, 0, 0, 0, 0, 0, 0, 0}, {0, 0, 0, 537, 729, 801, 606, 64, 187, 62, 15, 5, 0, 1, 0, 0, 0, 0, 0, 0}, {0, 0, 101, 302, 518, 523, 485, 326, 199, 78, 25, 5, 2, 0, 0, 0, 0, 0, 0, 0}, {0, 6, 29, 104, 192, 309, 253, 220, 107, 74, 21, 6, 2, 0, 0, 0, 0, 0, 0, 0}, {0, 1, 3, 23, 66, 95, 90, 90, 62, 43, 17, 6, 2, 0, 0, 0, 0, 0, 0, 0}, {0, 0, 3, 4, 9, 17, 39, 30, 21, 9, 8, 3, 0, 0, 0, 0, 0, 0, 0, 0}, 0, 0, 1, 2, 1, 8, 6, 4, 10, 4, 2, 1, 0, 0, 0, 0, 0, 0, 0, 0}, {0, 0, 0, 0, 2, 1, 2, 1, 1, 1, 0, 0, 0, 0, 0, 0, 0, 0, 0, 0}, {0, 0, 0, 0, 0, 0, 0, 0, 0, 0, 0, 0, 0, 0, 0, 0, 0, 0, 0, 0}, {0, 0, 0, 0, 0, 0, 0, 0, 0, 0, 0, 0, 0, 0, 0, 0, 0, 0, 0, 0}, {0, 0, 0, 0, 0, 0, 0, 0, 0, 0, 0, 0, 0, 0, 0, 0, 0, 0, 0, 0}, {0, 0, 0, 0, 0, 0, 0, 0, 0, 0, 0, 0, 0, 0, 0, 0, 0, 0, 0, 0}, {0, 0, 0, 0, 0, 0, 0, 0, 0, 0, 0, 0, 0, 0, 0, 0, 0, 0, 0, 0}, {0, 0, 0, 0, 0, 0, 0, 0, 0, 0, 0, 0, 0, 0, 0, 0, 0, 0, 0, 0}, {0, 0, 0, 0, 0, 0, 0, 0, 0, 0, 0, 0, 0, 0, 0, 0, 0, 0, 0, 0}, {0, 0, 0, 0, 0, 0, 0, 0, 0, 0, 0, 0, 0, 0, 0, 0, 0, 0, 0, 0}, {0, 0, 0, 0, 0, 0, 0, 0, 0, 0, 0, 0, 0, 0, 0, 0, 0, 0, 0, 0}, {0, 0, 0, 0, 0, 0, 0, 0, 0, 0, 0, 0, 0, 0, 0, 0, 0, 0, 0, 0}}
ArrayPlot[mut5, Mesh -> T rue, Frame -> True, FrameLabel -> {“Primary Mutations”, “Accessory Mutations”}, FrameTicks -> {{{{1, 0}, {2, 1}, {3, 2}, {4, 3}, {5, 4}, {6, 5}, {7, 6}, {8, 7}, {9, 8}, {10, 9}, {11, 10}}, None}, {None, {{1, 0}, {2, 1}, {3, 2}, {4, 3}, {5, 4}, {6, 5}, {7, 6}, {8, 7}, {9, 8}, {10, 9}, {11, 10}}}}, PlotLabel -> “Lee DB > 5 mutations”]

As a graduate student (visit my research lab homepage), and in my previous life in the pharmaceutical industry, I have been involved in scripting in some form or another. And inevitably, I have been stuck on some problem due to do a random technicality. More often than not, I have been able to find my answer through Google! But I’m sure there are others like me on this planet, trying to find similar things, so I thought it might be useful to upload and share some of the tools, ideas and programming scripts that I have come across over the years.
I made the plunge this month especially because I was inspired by my friend, and fellow graduate student’s blog. His research field, however, is different from mine, so our expertise, interests, and what we upload will be quite different too.
Hopefully this blog will be a helpful record, to myself, of interesting tools that I’ve come across. And secondly I hope it helps some people out there….